DevOps Meets Observability
Come Meet the Pyramid of Happiness!
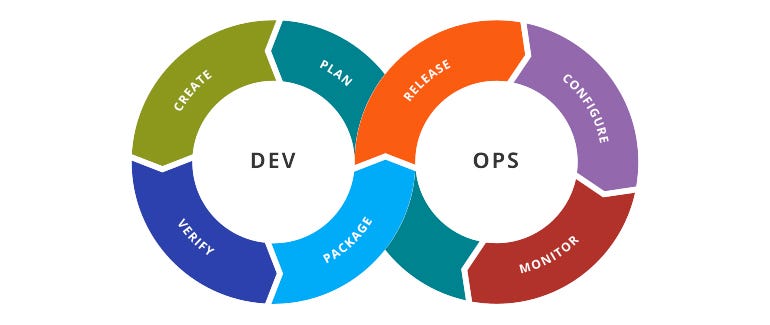
Feedback. The various diagrams out there describing DevOps workflow always include monitoring and feedback.
Without feedback, there’s no way of knowing whether a change worked or when a particular system encounters problems. Whether you’re developing code or delivering infrastructure, feedback is a vital part of being successful.
So, you know, we like feedback.
Over the decades, operations folks have gone from hey… check out the error from this deck of punched cards I loaded into the big honking computer we have in the machine room… the programmer isn’t going to be happy when she sees the errors next week, all the way through to everything that is required to manage the vastly complex collection of intertwined real-time systems employed across the globe today.
One service is easy to think about, five aren’t so bad. But what happens when you reach a hundred? Two hundred? A thousand? How can you cleanly and consistently get to the crux of a problem that you need to fix through the right level of feedback, irrespective of organizational scale?
Fundamentals of Observability
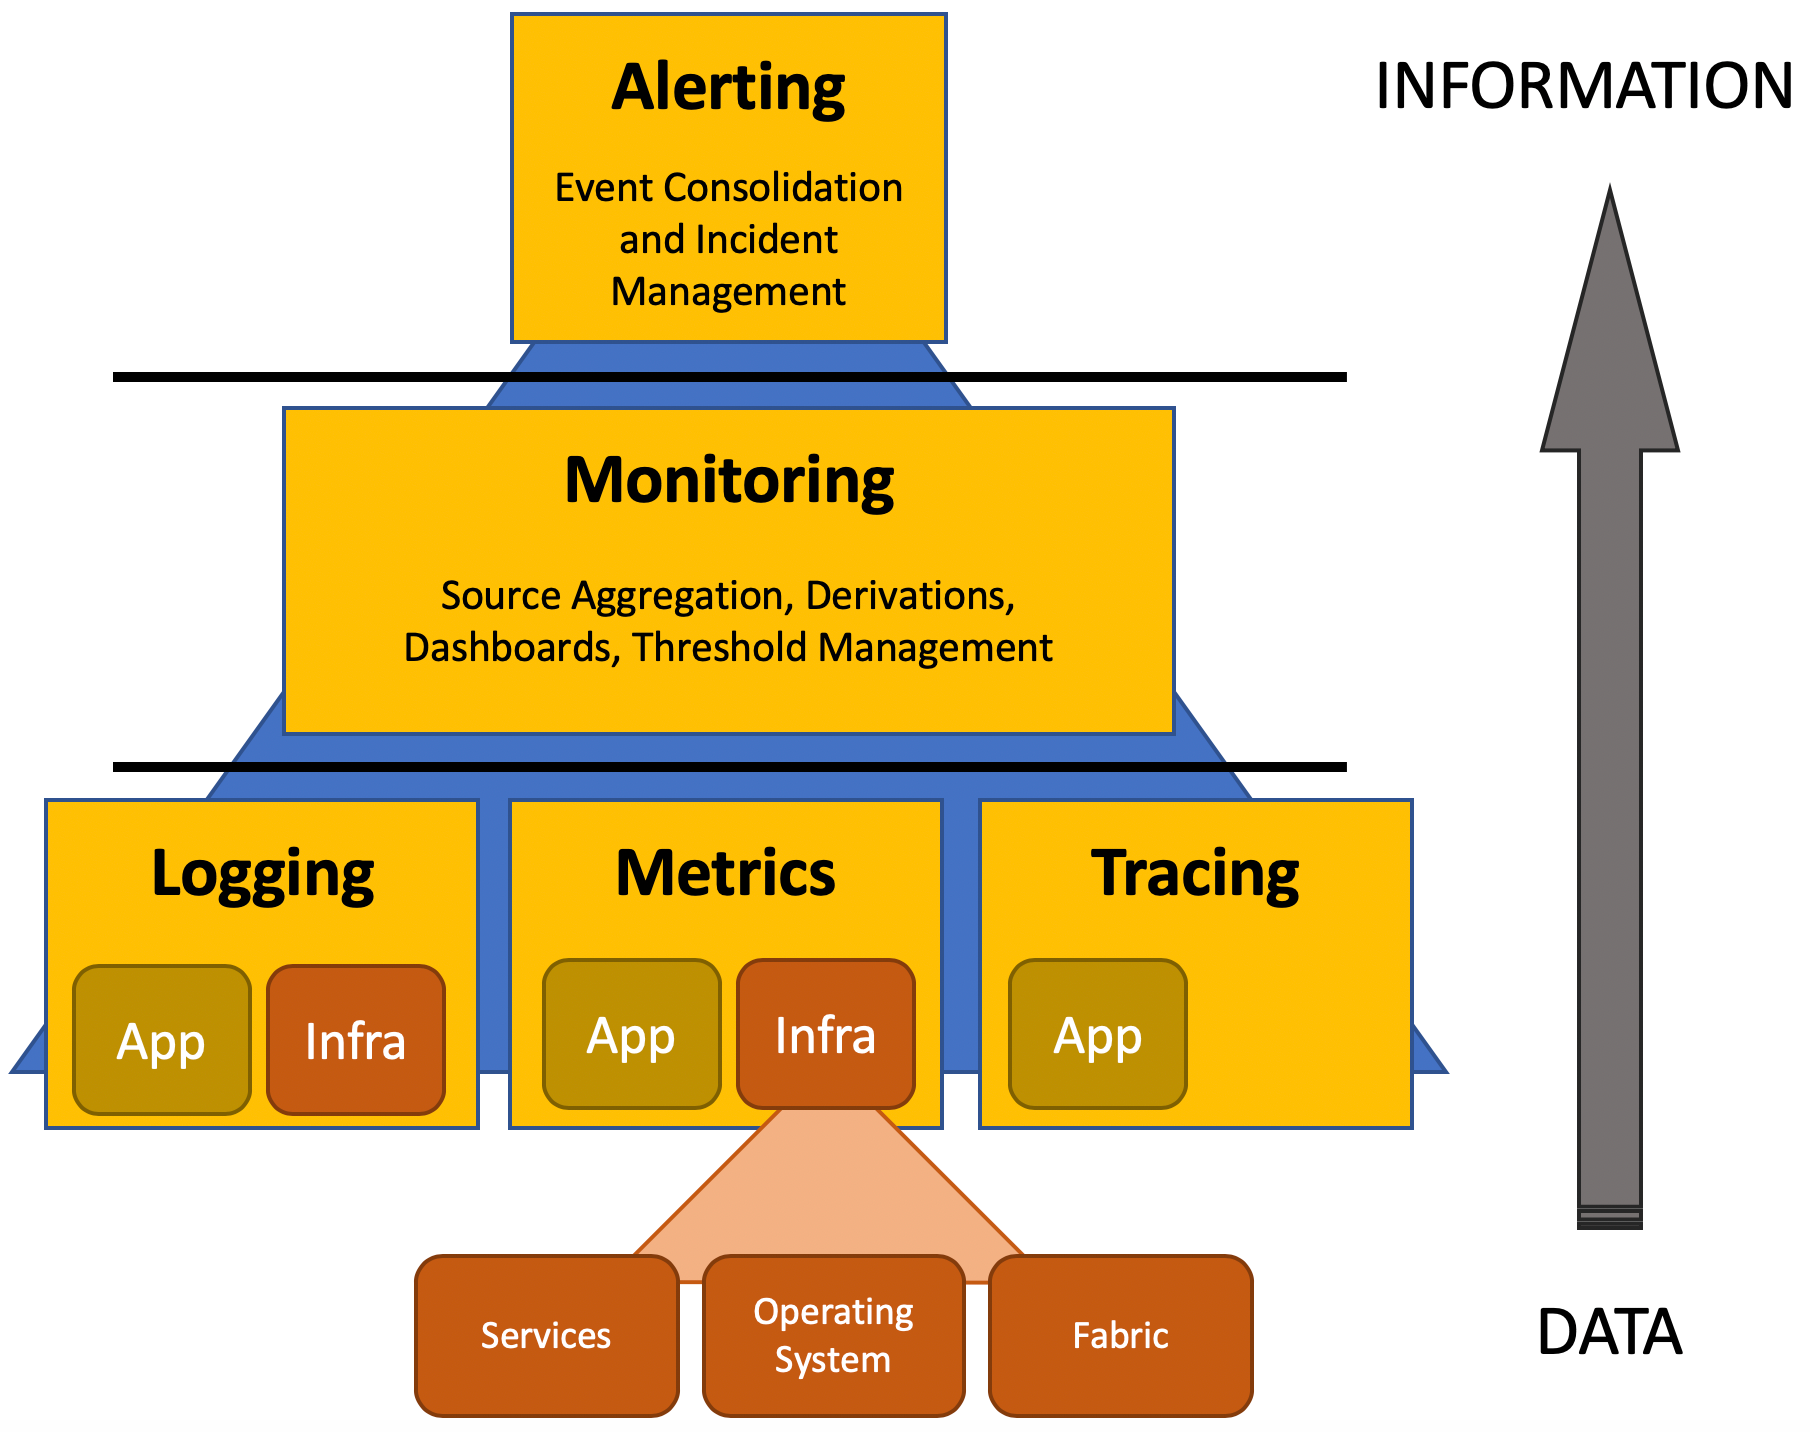
Whereas there has been talk for a while about the three pillars of observability, I think there’s a nicer and more intuitive structure to the tooling, which — with hardly any irony at all — I call the Pyramid of Happiness. The idea of the pyramid is that it’s a sort-of upside-down funnel that helps drive towards the right outcome. I’ll get into why I call it the Pyramid of Happiness later.
 The Pyramid of Happiness
The bottom of the pyramid represents a potentially enormous volume of events from various systems, which leave the proverbial needle in the haystack as a trivial challenge by comparison.
The top of the pyramid contains a distilled and (hopefully) small number of precise incidents that are all actionable.
Along the way, the middle tier allows key insights to be gleaned about operating efficiency.
We’ll go through each of these in some more detail, but the most important take away is to think about how we can maintain infrastructure that is as simple, uniform, and lean as possible so that we can use the tools efficiently for greatest value.
Tier 1: Generation
Application tracing is about recording execution flow through a piece of software, tracking things like method called details, response times, and so on. Although it can provide a huge range of insights, I’m not a huge fan of application tracing when it gets to the enterprise-wide/distributed model where you can spend a lot of money instrumenting code yet rarely use. I think there are better ways of diagnosing production problems with far smaller overheads, particularly if your code is implemented as loosely coupled micro-services. So I’m not going to talk about it. But it’s there if you want to explore the idea further.
For logging, the application emits either a text string, or JSON object detailing something that has happened while code is running.
For** metrics**, where a service provides a metric key (the what) and a value. This is combined with a timestamp (the when) to make time series data, so that values can be charted over a time interval as a set of data points.
For both logging and metrics, though, it’s not just the application that provides insight: fabric (like cloud infrastructure), databases, caches, queues, servers, and all sorts of things will generate telemetry providing varying degrees of insight.
Tier 2: Ingestion and Monitoring
DevOps scales effectively by quickly being able to isolate specific information domain that you’re interested in. So think about how you can segregate applications and services, just as the loosely-coupled micro-services pattern dictates.
Your monitoring platform of choice will typically ingest the various time-series values and aggregate in some way. Although Grafana calls the former data sources and the latter metrics, terminology will vary.
The purpose of this layer is to infer indicators from metrics derived from those data sources, and ultimately detect anomalies. Some examples of this might include flagging a problem if a given API returns errors more than (say) 1% of the time, or if response time exceeds (say) 100ms.
Our tooling split the monitoring layer across two tools: one for logs, one for metrics. But — of course — it depends on how you have things set up and the capabilities you have available.
In spite of how good an idea it might seem, not all raw metrics are useful in this context, and there are a bunch of measures that should never make their way to the top of the pyramid. For example: in an auto-scaling environment, free memory or CPU shouldn’t cause an event in its own right since the fabric should manage all that for you. Instead, consider triggering an event based upon the system performing slowly. If necessary, these other measures can then be examined as part of the troubleshooting procedure, but it’s important to not suffer death by a thousand cuts by configuring alarms based on as many things that can go wrong as possible.
If you’re doing DevOps correctly, there’s huge amount that can be eliminated as possible sources of error, and a lot can be done to assist in auto-healing using concepts like health checks.
As a side note, using average as a measurement statistic can be tricky, and please consider avoiding it. For example: looking at mean response time for a service may look absolutely fine, but it could conceal a small percentage of anomalies. Sometimes a measure using a high percentile will prove better at revealing outliers.
Tier 3: Alerting
Typically, an event is generated by the monitoring platform each time an anomaly is detected, which is exactly what we want it to do.
But as an engineer on call, it would be horrific to keep getting paged every five minutes with a new incident, even though you know there’s a problem and you’re already working on it, dammit.
So these events get consolidate into incidents, and — whereas the incident may get updated with a message saying something like “yep, still broken” — it’s all tracked as a single, representative incident.
Whichever tooling you use, the principles are the same: consolidate events into an incident, flag the incident, and track progress through to service restoration.

Flagging may mean multiple things. Paging is probably going to be your primary mode, but maybe you want to do something similar to us and post to a Slack or Teams channel as well, dedicated for the owner or application so that everyone is aware what’s going on with their services. You might also have something more holistic that posts for every incident state change, which is useful for oversight.
For paging, we don’t want to create an operational silo to manage moves adds and changes of team members. Silos are bad by slowing everything down and introducing risk of error. So it’s better to somehow have teams empowered to manage their own on-call schedules, with a couple of designated admins on each team to add and remove members, and so on.
Less is More
One of the challenges of the modern world is that there is an increasing trend for vendors from each of the three tiers to expand the scope of their features in order to grow their revenue base. So it’s really easy to recruit a broad range of tools to support your company’s observability needs. Remember, though, that the more tools you have on-hand…
the more pathways there are to generate an incident
the more there is for developers to learn
the more work there is for somebody to administer the tools
the further you retreat from a single pane of glass
Here’s an example: your company bought licenses a three years ago for AppDynamics and Splunk, then bought new NewRelic licenses two years ago because it has some other cool features, and bought a subscription to PagerDuty at the same time. Since then, though, Splunk acquired VictorOps. Because there is ambiguity in the preferred way of doing things, and a degree of manual set-up, some teams will go on-call with PagerDuty, others with VictorOps. Some services will be instrumented with AppDynamics, others with NewRelic.
At this point, new projects will go through a phase of analysis paralysis as they determine which of these available approaches is the best fit, and time will be lost for no perceptible gain. Even worse, with multiple places to go to look at dashboards, time will be lost by those not in-the-know tracking down the tool that’s being used for a particular project.
If there are two or more ways to accomplish an observability objective, you’re sure to see all of them implemented. Increased ambiguity will have an adverse impact on simplicity.
Summary
As with a lot of the things I write, we learned a huge amount along the way through trial and error. Your experiences may take you down a slightly different path, but with simplicity, coherency and a Cattle not Cats mentality, it becomes easy to adopt best practices around observability.
As these ideas are instilled — and let’s be honest — as we get calls at 3am cheerfully informing us that our production service is down — we intrinsically reevaluate how to design and write software in a more reliable way. Reliability becomes a first class consideration.
As reliability becomes a first class consideration, we get fewer outages. As we get fewer outages, our energy can move from reactive panic to proactive analysis of the metrics that provide insights to our services and start spending more time thinking about optimization.
That’s the Pyramid of Happiness.
p.s. Thanks to Chris Talbot for graciously permitting theft of his meme, Nirav Shah for inventing the Nirav-O-Tron auto-dashboard concept, and Vida Popovic for being reviewer and mentor.
p.p.s. Want another perspective? Cindy Sridharan’s article on Monitoring and Observability is an excellent resource.
p.p.p.s. Check out this great monitoring overview from Grafana. I promise they didn’t pay me.

Follow us on Twitter 🐦** and Facebook 👥 and join our Facebook Group 💬.**
To join our community Slack 🗣️ and read our weekly Faun topics 🗞️,** click here⬇**

If this post was helpful, please click the clap 👏 button below a few times to show your support for the author! ⬇
This article originally appeared on Medium.