Monitoring Operational Performance
Monitoring Operational Performance
 Judge Robert Rosenberg of the Broward County Canvassing Board; Robert King/Getty Images**
I’ve spent some time talking about Observability and DevOps, but it turns out that there’s some nuance to knowing how well the organization is transitioning down the path. Are developers truly becoming proficient at supporting their own code, and are they free from the shackles of silos?
From a governance perspective, it’s important to gauge how well teams are doing, as well as the organization as a whole. Whereas it’s great when it seems that the total number of incidents and repair time are trending downwards over time, but with the correct insights, it’s possible to steer those conversations empirically.
As we went down this path, I picked four indicators that would provide insight. You may have a different list.
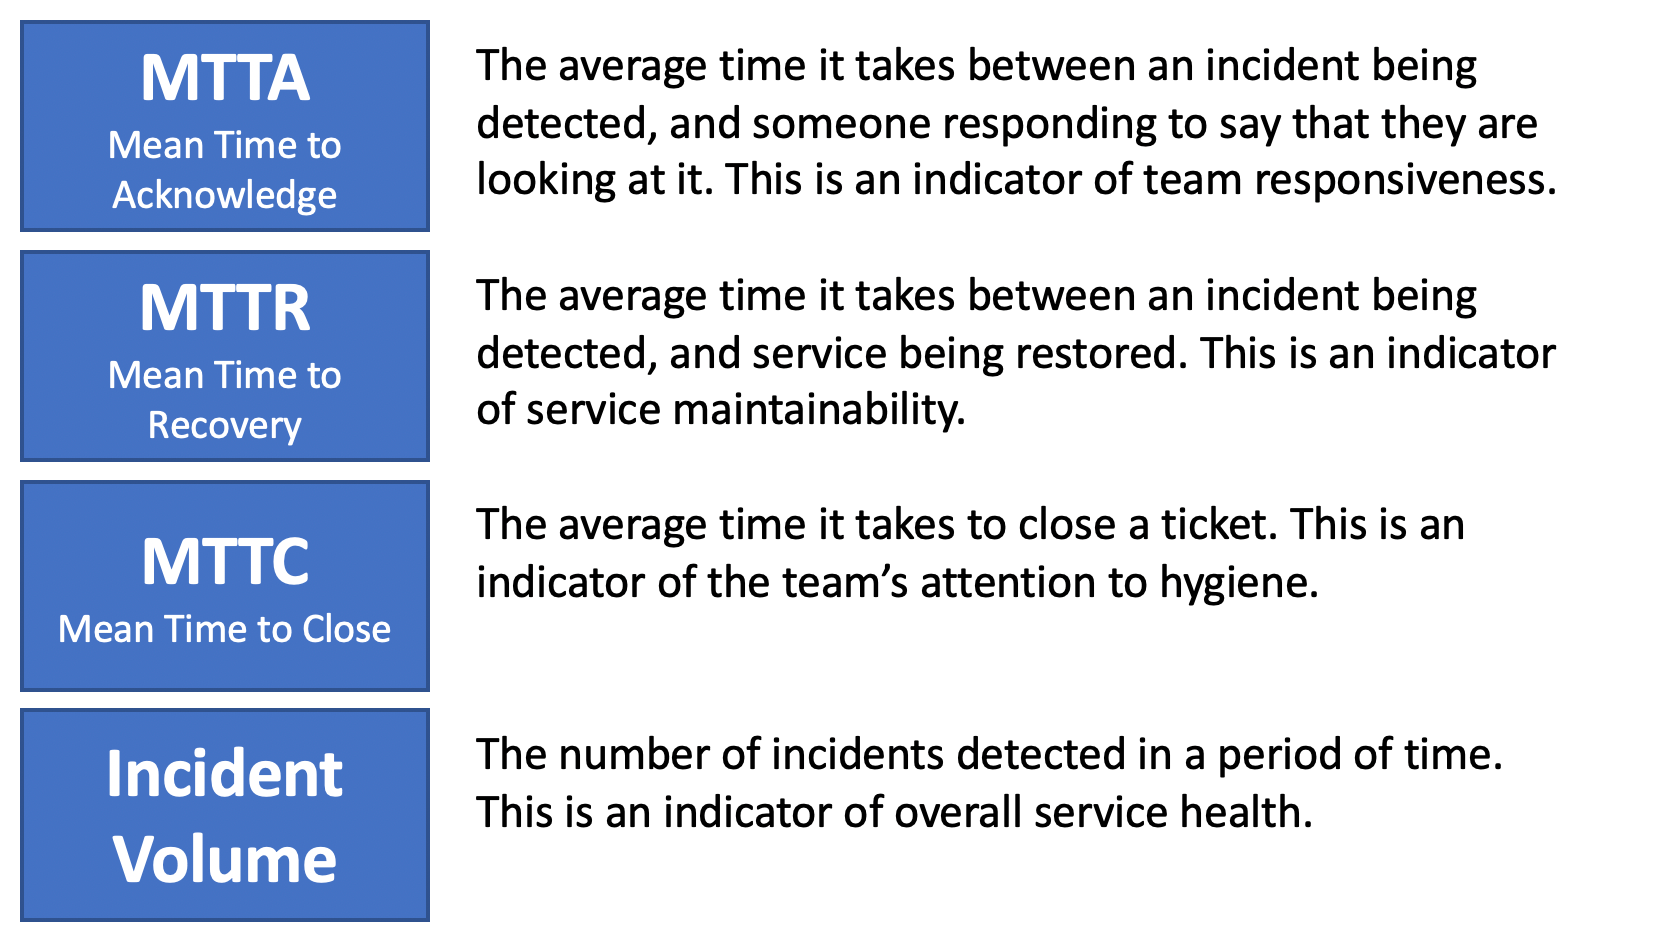
Perhaps you’ll find the number of times a team gets paged for an incident a useful alternative to MTTA.
Two of the early big indicators of success in our DevOps transformation were dramatic reductions in MTTR and volume, but we’d always take blips in MTTA and MTTC as new teams are onboard. It was helpful to develop a status board where we could see how incidents were being addressed in real-time. I created a VictorOps Dashboard for which the loading page looks like this:
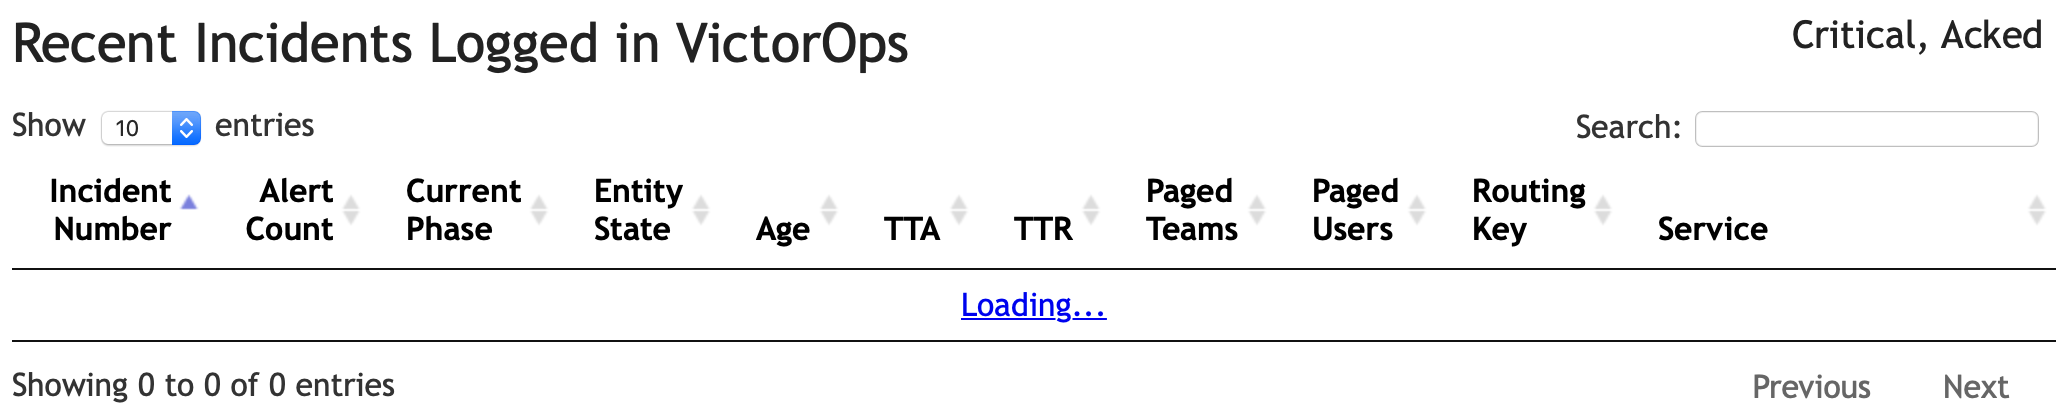
Perhaps the incident management tool you use already has something like this. If not, though, then consider applying this or something similar to keep insights into how well your teams are acclimatizing to this change of ownership.
Personally, I’d err on the side of avoiding more complex indicators such as number of customers impacted or revenue lost, but it’s up to you: If you’re confident that the extra effort it will take to determine these numbers with a sufficient degree of accuracy will drive the correct behaviors in terms of getting the underlying root causes fixed, then great. If not, then wouldn’t it be better to spend that same energy working on addressing underlying problems? Which route will have the greatest impact on service availability?
One Final Note
Take a look at Goodhart’s Law: use these indicators to drive empirical conversations around improving operational models, but don’t just give teams the tools and set targets for them: this will likely drive the wrong outcome.
Thanks to Robert Boxall for recommending the title image.
This article originally appeared on Medium.